
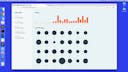
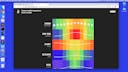
Data Visualization + D3.js
Learn how to create interactive, engaging experiences using HTML, CSS, SVG and Javascript.

Taught by
Rik Lomas


Get access to Data Visualization + D3.js
- Practical, go-at-your-own pace learning, with help from our industry experts and experienced teachers
- Projects and code that you can alter and include in your own sites and portfolio
- Resources to get you started and going post-course
Your instructor

Rik Lomas
With support from...

Kristen Altomare-Ciallella
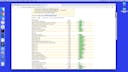
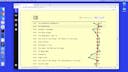
Course structure
Lesson 01
Welcome to the Data Visualization + D3 course
Lesson 02
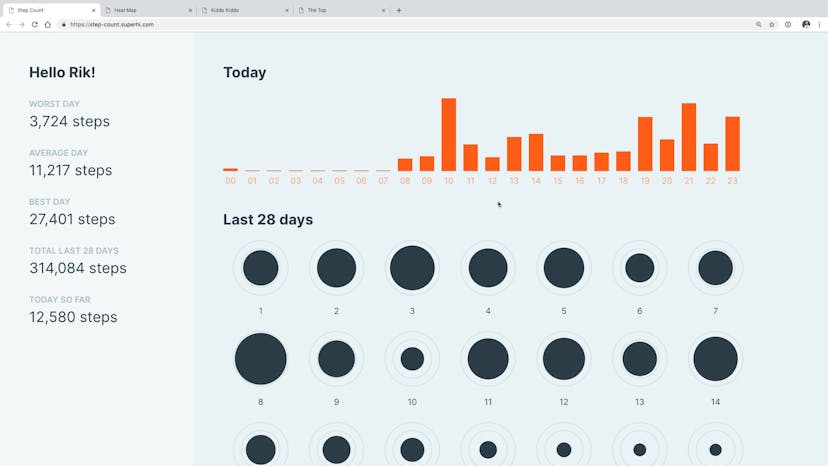
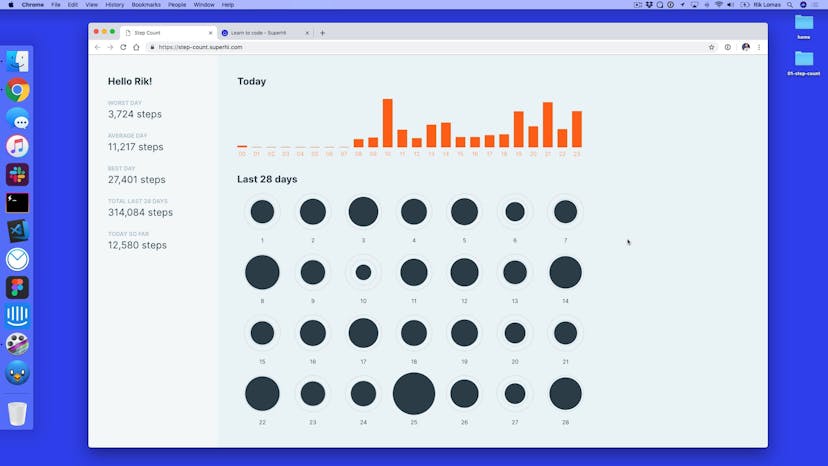
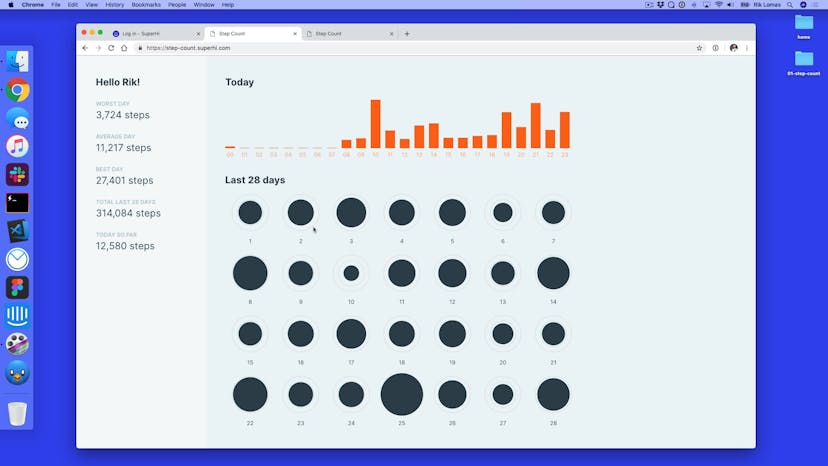
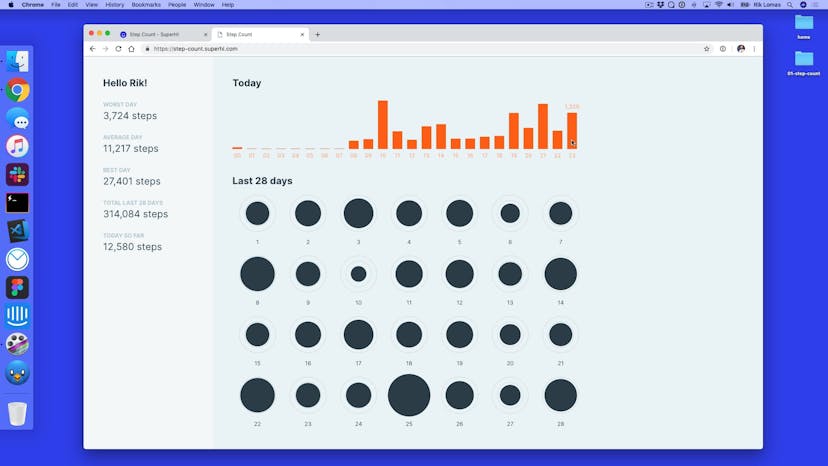
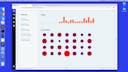
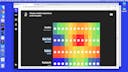
Introduction to the Step Counter project
Lesson 03
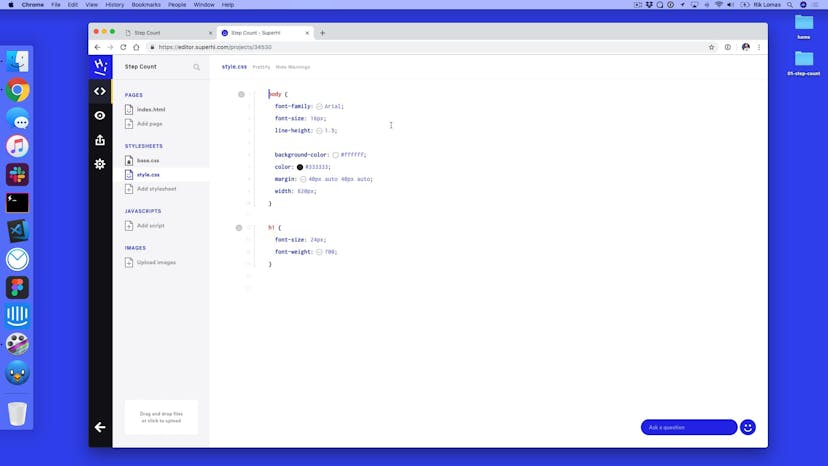
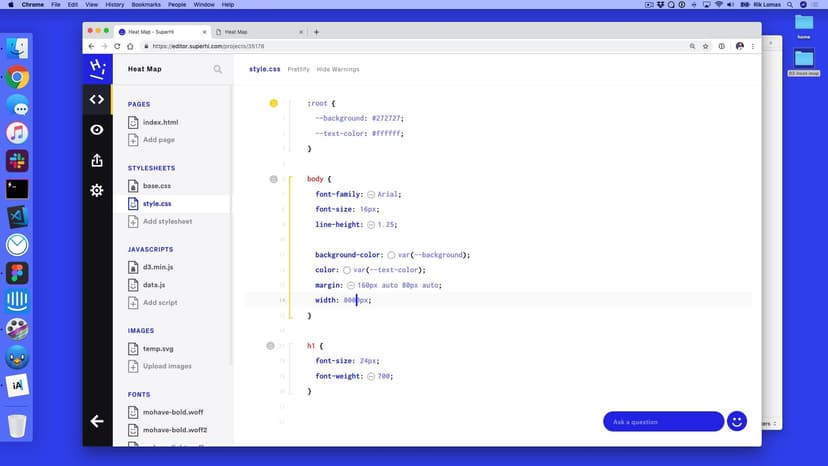
What is the SuperHi Editor?
Lesson 04
Adding basic HTML structure for our project
Lesson 05
Adding navigation bar content
Lesson 06
Introducing our CSS
Lesson 07
Adding webfont typography
Lesson 08
Adding extra type styles
Lesson 09
How to add CSS rules
Lesson 10
Adding spacing using margins
Lesson 11
Giving our project layout with CSS Grid
Lesson 12
Filling in our main content area
Lesson 13
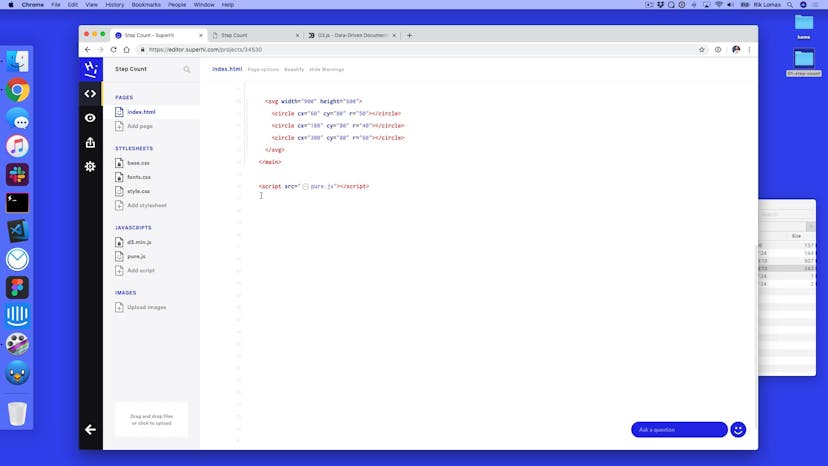
Inside an SVG
Lesson 14
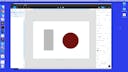
Adding a rect tag
Lesson 15
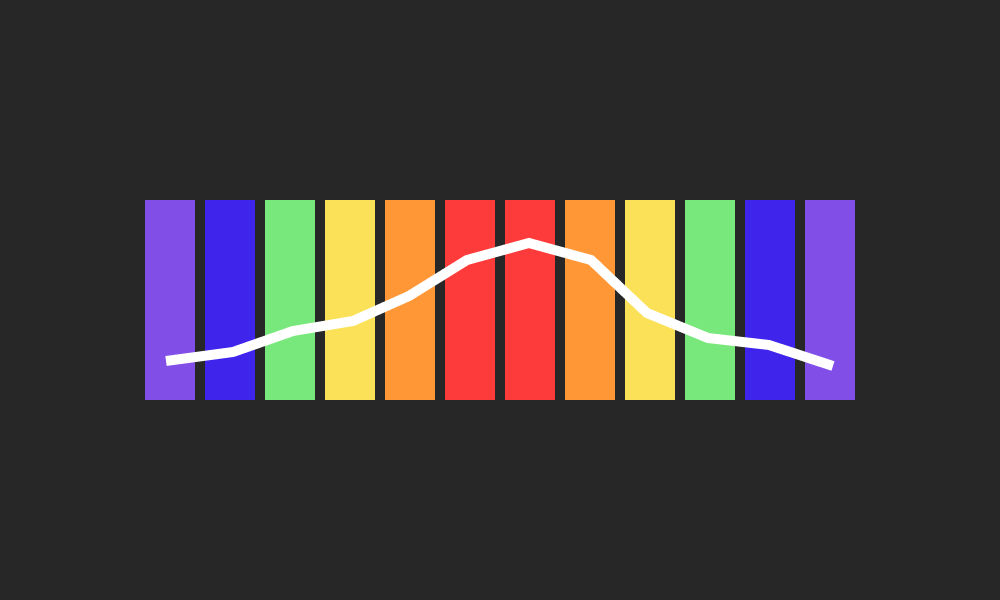
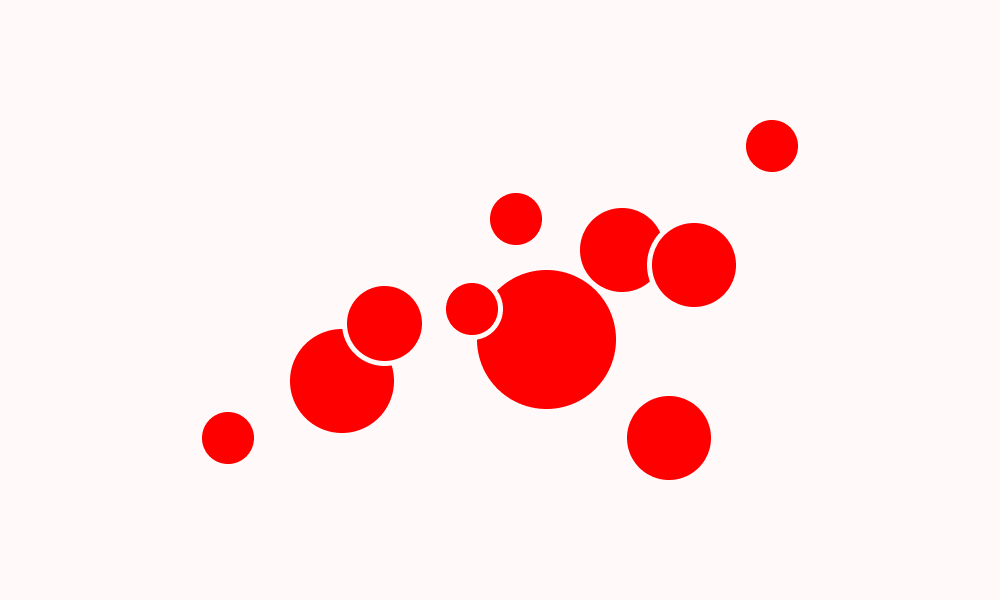
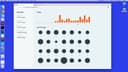
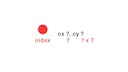
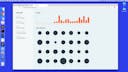
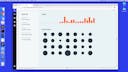
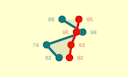
Drawing circles
Lesson 01
Welcome to automating our HTML
Lesson 02
How to add a Javascript file

Lesson 03
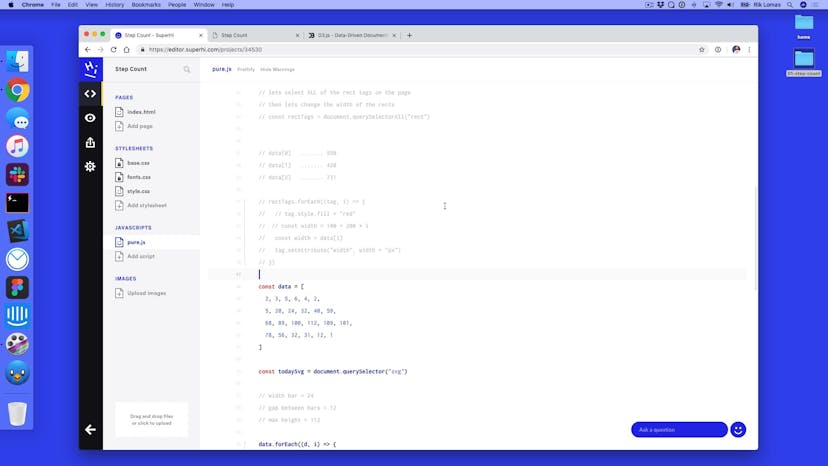
Picking tags and changing HTML
Lesson 04
Updating the style of selected tags

Lesson 05
Using forEach to loop through tags
Lesson 06
Variation: adding randomness
Lesson 07
forEach with an index

Lesson 08
Changing our rect tags using forEach

Lesson 09
Using index to change widths
Lesson 10
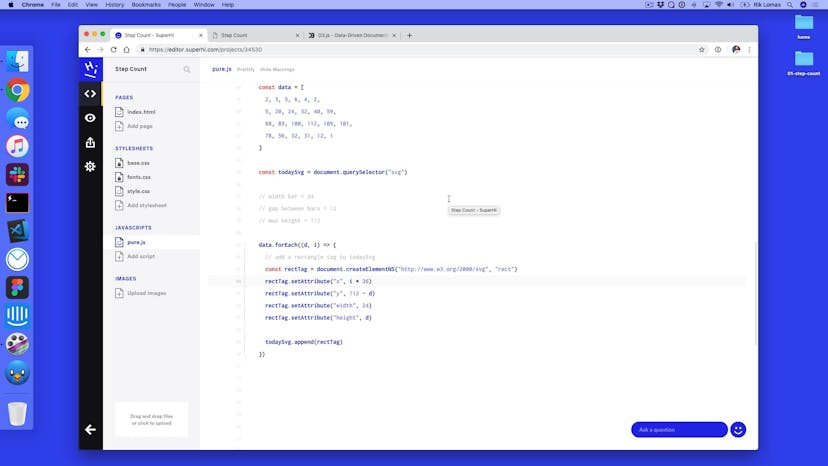
Adding in a data array
Lesson 11
Automating addition of rect tags
Lesson 12
Positioning our rect tags
Lesson 13
Homework
Lesson 14
Homework solution
Lesson 01
Welcome to Week 2!

Lesson 02
What is D3 and why do we use it?

Lesson 03
How to add D3 to a project

Lesson 04
Using select and selectAll with D3

Lesson 05
Adding data to D3 and using attr
Lesson 06
Automating attribute changes
Lesson 07
Adding in rect tags automatically with D3
Lesson 08
Adding in real data
Lesson 09
Introducing scales
Lesson 10
Adding text tags to our data visualizations

Lesson 11
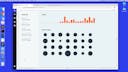
Adding classes and circle tags
Lesson 12
Thinking about grids

Lesson 13
The modulo (%) and Math.floor to make a grid
Lesson 14
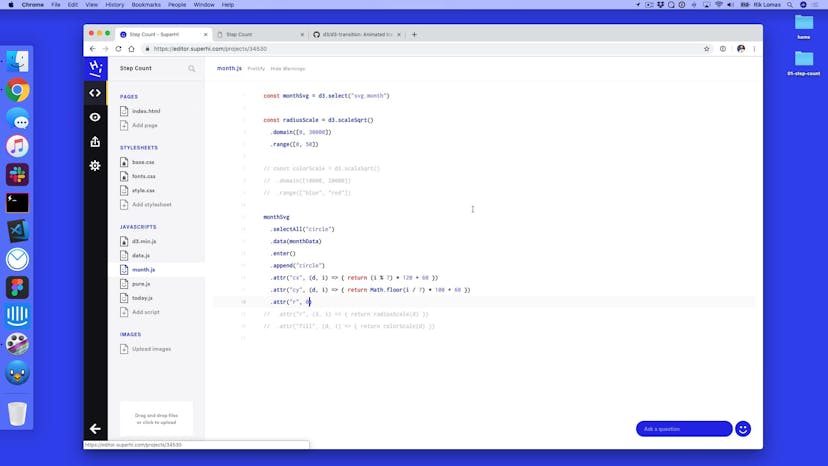
Scaling our circle's radius
Lesson 15
Homework
Lesson 16
Homework solution
Lesson 01
Welcome to the final part of Step Count
Lesson 02
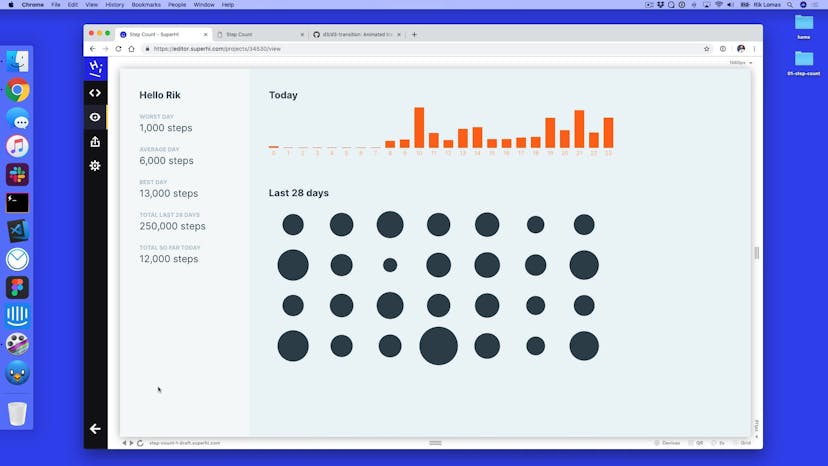
Adding in a transition
Lesson 03
Adding delay and easing to transitions
Lesson 04
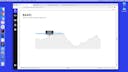
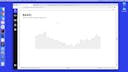
Adding transitions to our bar chart
Lesson 05
Why we group tags in our visualizations
Lesson 06
Adding g tags to our bar chart
Lesson 07
Adding our second text tags
Lesson 08
Adding hover states using CSS

Lesson 09
Adding both classes and states in CSS
Lesson 10
Hovering within a group
Lesson 11
Adding a group for our circles
Lesson 12
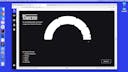
Adding in goal rings using stroke
Lesson 13
Adding text to our Last 28 Days section
Lesson 14
Altering HTML content

Lesson 15
D3's array functions
Lesson 16
Using D3 Format

Lesson 17
Homework
Lesson 18
Homework solution
Lesson 01
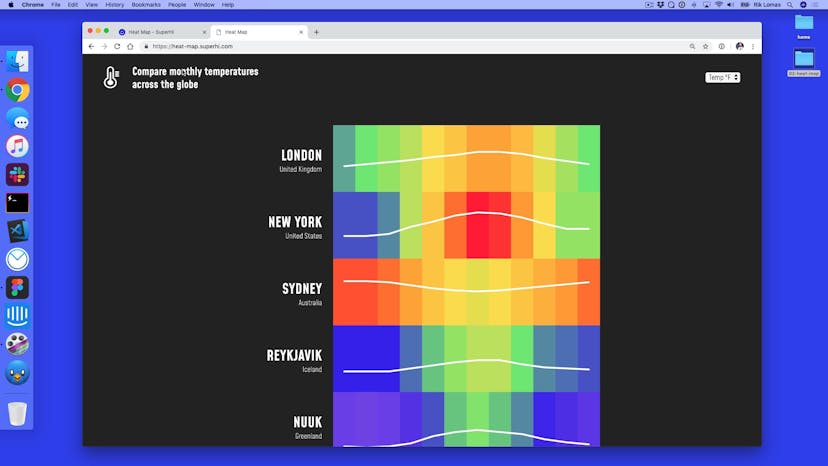
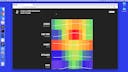
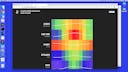
Welcome to Heat Map

Lesson 02
Creating our HTML content
Lesson 03
Adding our overall page styling
Lesson 04
Adding our header layout
Lesson 05
Storing data in arrays and objects
Lesson 06
How our data file looks
Lesson 07
Data collection using the Javascript Developer tools
Lesson 08
Adding our script tags
Lesson 09
Reflecting our data in design
Lesson 10
Setting up our group tags

Lesson 11
Adding our cities to the data visualization
Lesson 12
Adding our country text tag
Lesson 13
Adding data groups within data points
Lesson 14
Color scales
Lesson 15
Adding labels to our heat map

Lesson 16
Adding box scale
Lesson 17
What is a path tag
Lesson 18
D3's line generators
Lesson 19
Changing temperature units with a select tag
Lesson 20
Homework
Lesson 21
Homework solution


Lesson 01
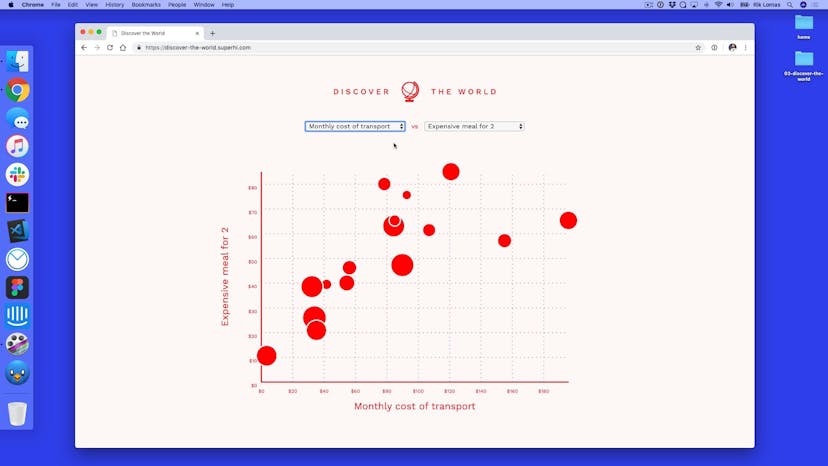
Welcome to Discover The World
Lesson 02
Setting up our HTML

Lesson 03
Adding our styling

Lesson 04
Adding our own Javascript functions
Lesson 05
Adding events to both page load and select tag changes
Lesson 06
Setting up our Javascript
Lesson 07
How we got our data source
Lesson 08
Adding groups per city
Lesson 09
Adding scales to our data
Lesson 10
Changing our data depending on which value
Lesson 11
Hooking our select tags up
Lesson 12
Adding movement to select changes
Lesson 13
Changing our circle radius data
Lesson 14
Adding axes
Lesson 15
Styling our axes
Lesson 16
Adding axis labels
Lesson 17
Adding a city label
Lesson 18
Raising in D3
Lesson 19
Responsive design with SVG viewBox
Lesson 20
Homework
Lesson 21
Homework solution
Lesson 01
Welcome to The Top
Lesson 02
Why this data and why visualize it in this way

Lesson 03
Setting up our HTML
Lesson 04
CSS page styles
Lesson 05
Styling our header
Lesson 06
Making a sticky header
Lesson 07
Creating our groups from the data set
Lesson 08
Fixing our text and header
Lesson 09
Adding circle tags to each group
Lesson 10
Sorting our data by a key
Lesson 11
Sorting data by the select tag + homework
Lesson 12
Homework solution
Lesson 13
Data visualization accessibility
Lesson 01
Welcome to part 2 of The Top
Lesson 02
Adding a background hover to each group
Lesson 03
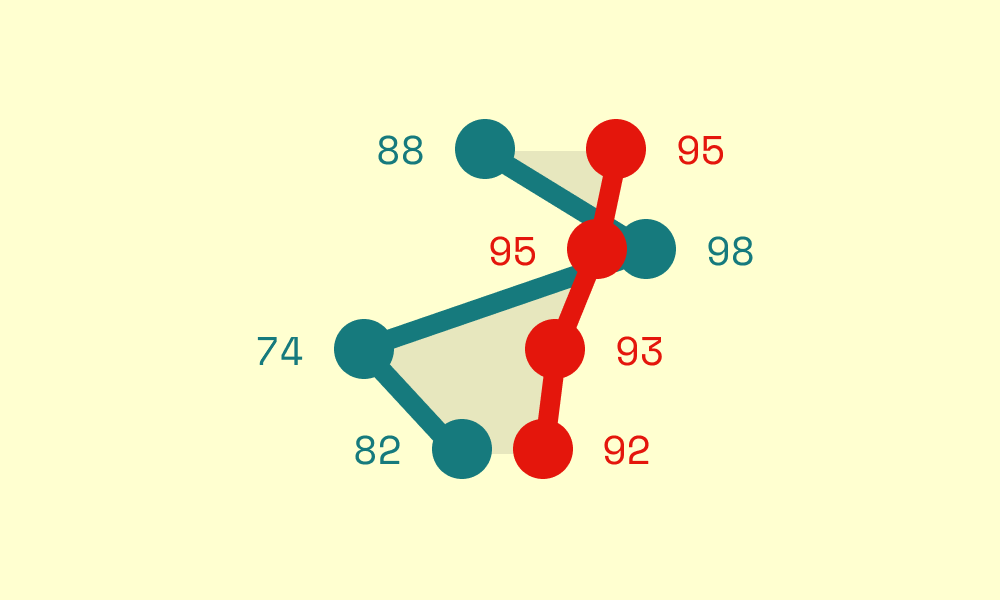
Adding our line shapes
Lesson 04
Updating our lines on select box change
Lesson 05
Adding curves to lines
Lesson 06
D3's area shape
Lesson 07
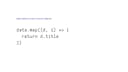
forEach vs map
Lesson 08
Making a difference
Lesson 09
Adding our text scores
Lesson 10
Responsive design, part 1
Lesson 11
Responsive design, part 2
Lesson 12
Homework

Homework 01
Spin class

Lesson 01
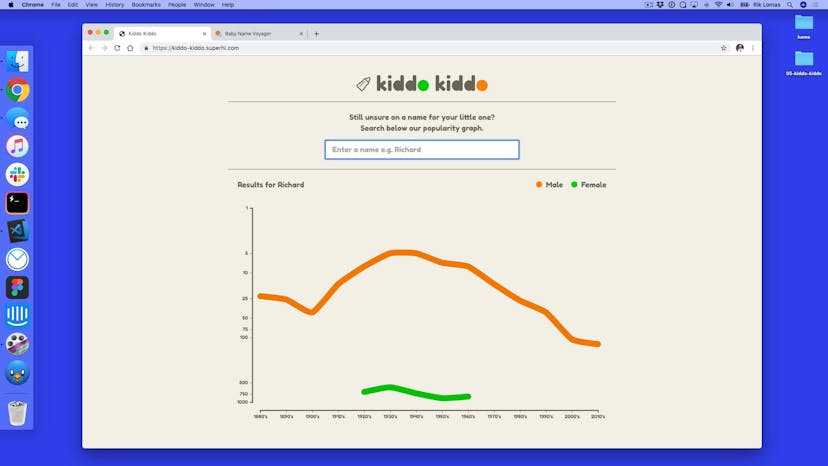
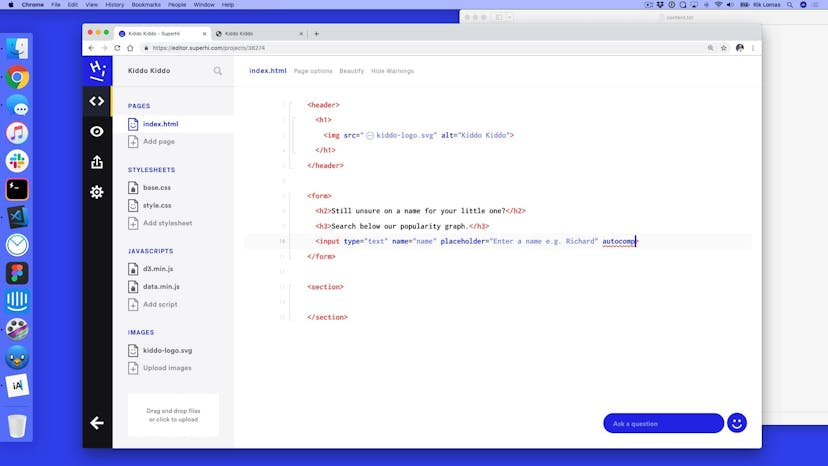
Welcome to Kiddo Kiddo
Lesson 02
Our data source
Lesson 03
Adding our HTML content
Lesson 04
Styling our header and form
Lesson 05
Styling our key
Lesson 06
Setting up our form in Javascript
Lesson 07
Filtering the data set
Lesson 08
Adding our paths
Lesson 09
Defining paths
Lesson 10
Exit data
Lesson 11
Adding axes
Lesson 12
Different types of scales
Lesson 13
Transitioning in and out
Lesson 14
Gendering colors
Lesson 15
Homework
Lesson 01
Welcome to Boundless
Lesson 02
Setting up our project
Lesson 03
Setting up our updateGraph script
Lesson 04
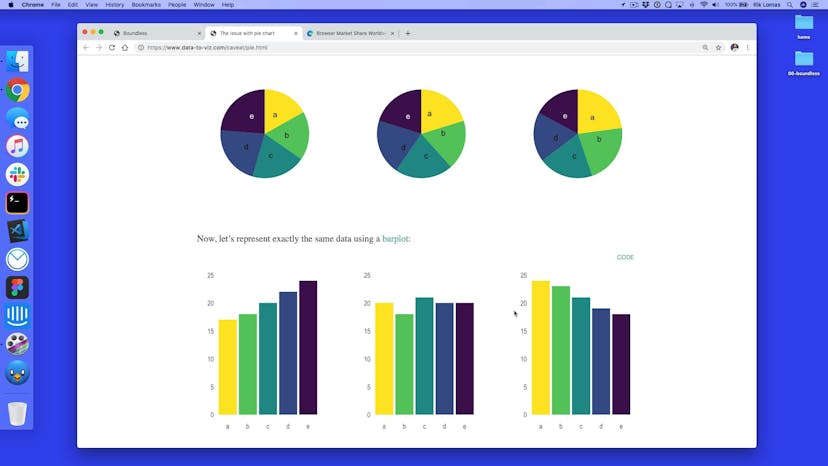
Making a quick bar graph
Lesson 05
Making a pie generator + arc generator
Lesson 06
Pie and arc options
Lesson 07
Update the pie chart on next button
Lesson 08
Autoplaying the visualization
Lesson 09
Time formatting
Lesson 10
Stopping the loop when we have no data
Lesson 11
Arc tweening
Lesson 12
Homework
Lesson 01
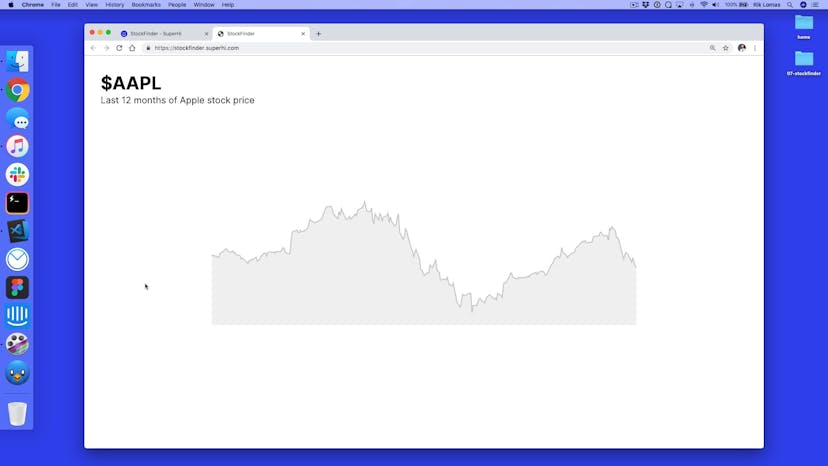
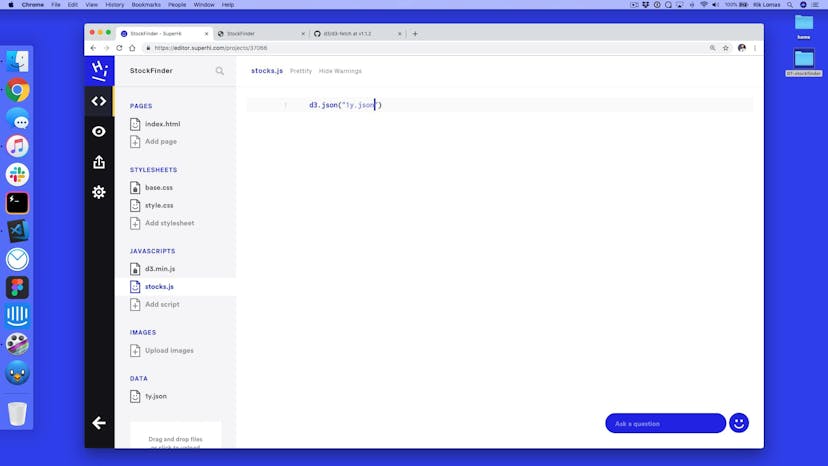
Welcome to StockFinder
Lesson 02
Setting up our project
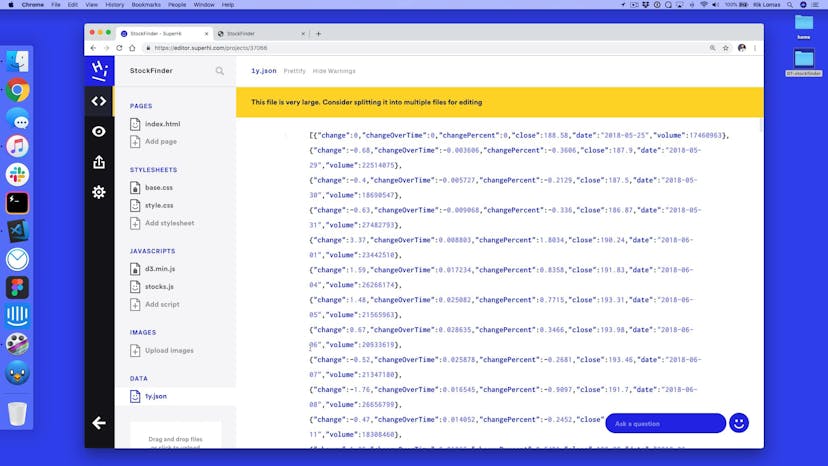
Lesson 03
Pulling our data in using d3.json()
Lesson 04
Processing our data
Lesson 05
Finding the min and max data points
Lesson 06
Adding our scales
Lesson 07
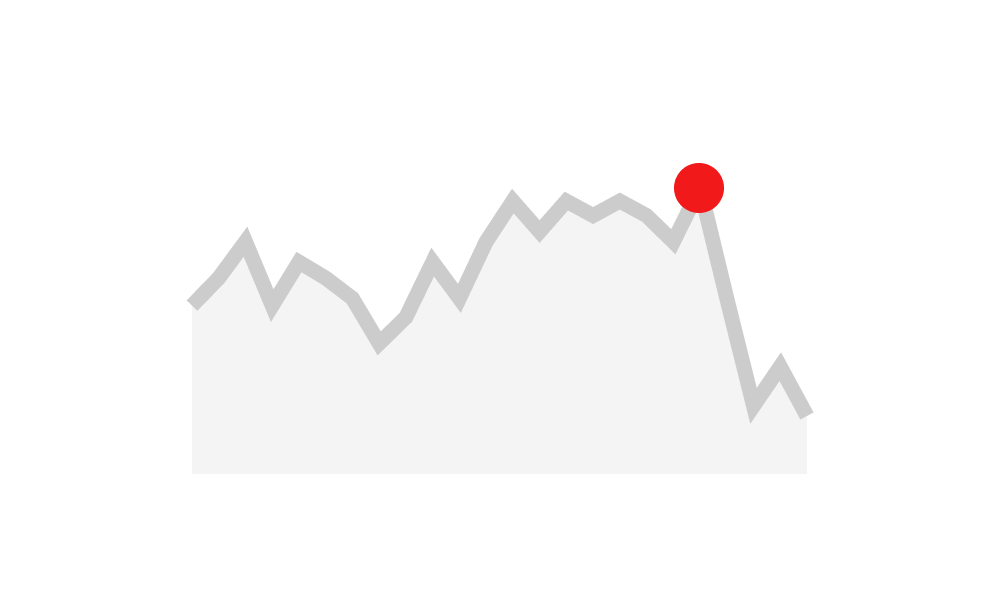
Making our line generator and graph
Lesson 08
Adding an area generator
Lesson 09
Adding in live data
Lesson 10
Adding in our hover tooltip
Lesson 11
Moving our tooltip across the page

Lesson 12
Hiding our tooltip on mouseout

Lesson 13
Finding the date on hover
Lesson 14
Bisecting our data
Lesson 15
Fixing our tooltip to the line
Lesson 16
Extra resources
Lesson 01
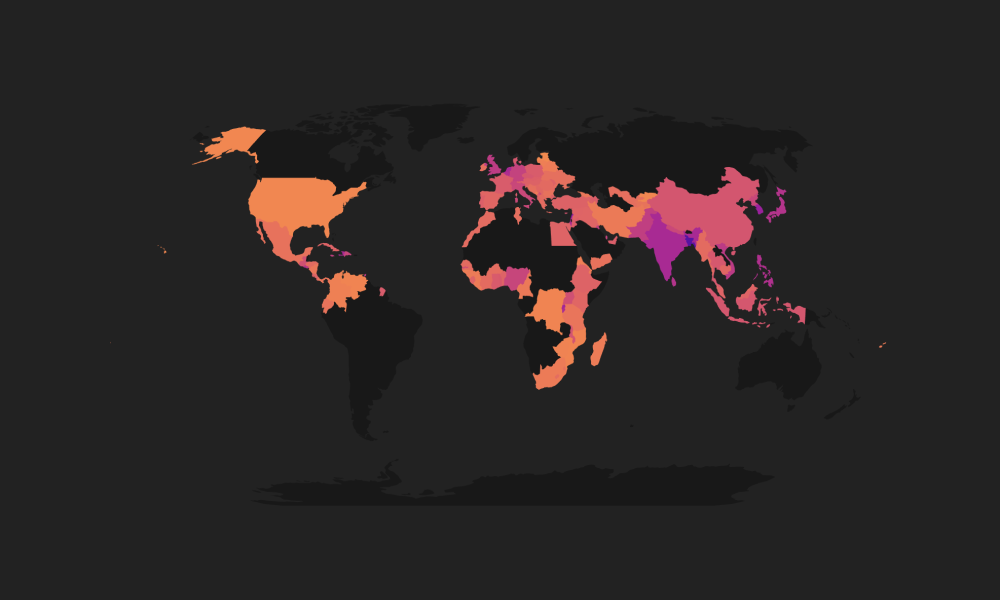
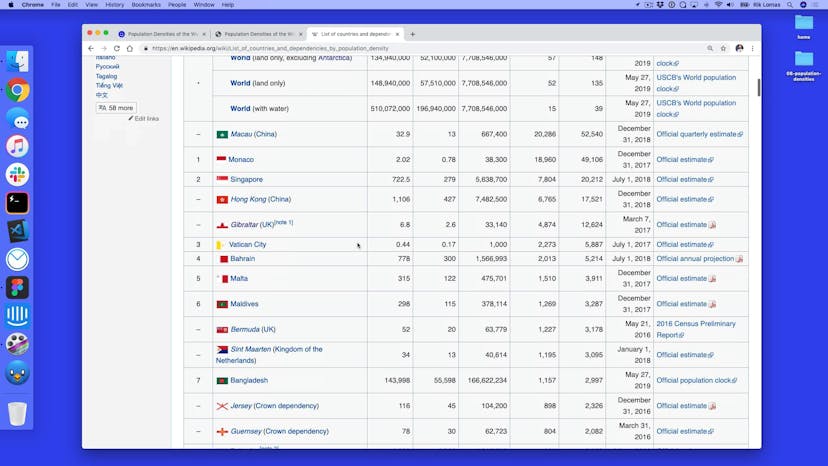
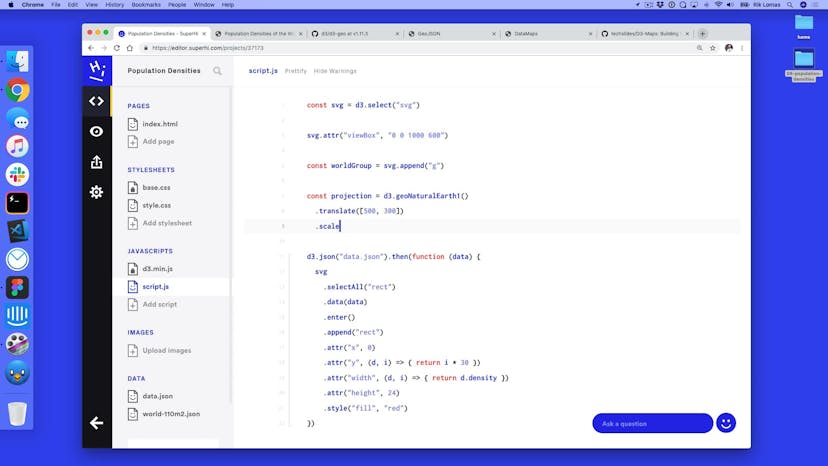
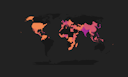
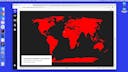
Welcome to Population Densities of the World
Lesson 02
Loading in our dataset
Lesson 03
Adding in map projections
Lesson 04
Drawing country by country
Lesson 05
Highlighting a country

Lesson 06
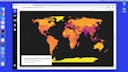
Mapping our data to our countries
Lesson 07
Adding a color scale
Lesson 08
Filtering based on scroll
Lesson 09
Adding scales to our scroll position
Lesson 10
Homework

Lesson 11
Thank you for being part of our course!
SuperHi students work at the best
Our students are based all over the world and work at creative companies large and small. Why not check out some of their work?
View student workFeeling stuck?
Don’t worry, we are here to help you with:
- Speedy help from one of our team members
- Detailed, relevant solutions
- Direct access to peer support through Discord!
Remember, there’s no such thing as a silly question, so don’t hesitate to reach out, we love hearing from you!